Projects

Live Programming in Validating AI-Generated Code (2023.1 - 2023.9) [paper]

AI-generated code is helpful as building blocks towards a complete program, but validating the behavior of such code is not easy. What if we utilize live programming to facilitate the validation of AI-generated code? We built a prototype incorporating live programming and an AI-powered program synthesizer and probed its effects through a user study. Our results demonstrate the effectiveness of live programming in validating AI-generated in a variety of ways.

Functional Debugging (2022.9 - 2023.1) [paper]

Programmers use debuggers for imperative languages to facilitate debugging. How about debuggers for functional languages? Do functional programmers use debuggers? Or even, how do functional programmers debug? We do not have enough evidence to answer these questions. As an initial step, we interviewed four expert Haskell programmers to find out. Our preliminary findings show that while debugging strategies for Haskell are similar to strategies for other languages, some features of Haskell and functional programming introduce challenges to using these debugging strategies.

Online Z3 Guide (2022.6 - 2022.9) [code]

I implemented the Z3 Guide, a 100% client-side web-based programming/learning environment for Z3 during my Internship in summer 2022 at Microsoft Research, working with Ayana Monroe, Dr. Nikolaj Bjorner and Dr. Peli de Halleux. The development of Z3Guide adopted an iterative design, and has been well perceived by educators and learners of Z3. It is also a first step towards reviving rise4fun, a legacy web environment for research tools developed at RiSE @ MSR. See my fork of the version concluded at the end of my internship, or here for the most recent official Z3Guide.

Debugging GUI Applications (2021.12 - 2022.9) [paper]

GUI applications often preserve complex behavior building upon at least three layers of information: GUI changes, code execution, and user-interactions. To help programmers reason about the behavior of GUI applications, we implemented a debugger that directly displays intermediate GUI states without requiring probing into code execution. Without using logs or breakpoints, users can see a timeline of changes in the GUI and their connections to the code in the tool, and such information is always up-to-date to the code.

SnipPy+ (2021.3 - 2021.9)

Built on top of SnipPy, SnipPy+ features a new interaction flow where the user can constantly interact with the synthesizer without leaving and restarting the specifications writing process: they can (1) see synthesis results as they are typing in specifications and (2) keep modifying the specifications / inspecting new synthesis results, until they intend to exit the process.

PopPy (2021.1 - 2021.3) [paper]

I explored the idea of PopPy in collaboration with Kasra Ferdowsi in a class project. Also built on top of SnipPy, PopPy allows the user to write partial instead of full specifications for program synthesis, which can be especially useful when the specs involve long, complicated data structures.

Projection Boxes for Education (PB4Edu) (2020.8 - 2021.3) [paper] [talk]

We used Projection Boxes, a Live Programming visualization, in an introductory programming class with 600+ students at UCSD over one academic quarter, and found that students preferred Projection Boxes to the baseline IDE and considered them helpful for their learning.

Venbrace (2019.1 - 2020.7) [thesis] [poster] [demo]

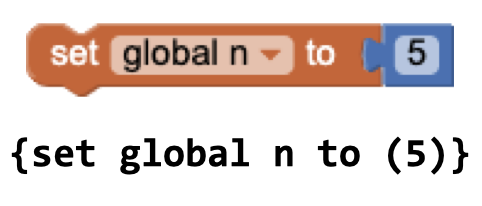
Venbrace is a textual representation for the block-based MIT App Inventor. Its design is principled and empirically evaluated through two user studies. Although no conclusive evidence was found from either study, this project is my first exploration in the space of human-centric programming language design.

Visualizing TwitterTrails Stories (2018.1 - 2018.10) [poster]

TwitterTrails is a tool that allows members of the media to track the trustworthiness of stories shared on Twitter co-built by Panagiotis Metaxas at Wellesley College. My prototype visualizes the stories (circles) and their tags (linked lines connecting the circles to the dots on the outer bigger circle) alongside their magnitudes of spread (sizes of circles) and levels of trustworthiness (blue=undisputed, red=doubtful) as determined by TwitterTrails’ algorithm. With this interactive visualization, users are able to focus on stories/tags of their interest through the filtering mechanism and interpret metrics of a story more easily without examining its associated tweets.